Performance-linked Retirement Annuity fee structures: When the manager's pay moves with the fund's returns
26 July 2026
The Living Annuity Masterclass: How to maximise your retirement income


The views and opinions expressed in this article are those of the author and do not necessarily reflect the official policy or position of 10X Investments.
Two investors, the same R500,000, the same retirement market. Thirty years later, one has close to R1.8 million more than the other, and the gap has nothing to do with which fund performed better. It comes down to how each provider chose to charge for the same product.
That is the finding this Fee Architecture Series is built on. Episode one put five South African retirement annuity providers through the same test (a R500,000 lump sum, the same thirty-year assumptions) and came back with five fundamentally different ways of pricing what looks identical on a marketing page. Episode two took a deep dive into the first of those five fee structures: a model that charges for a financial advisor, regardless of whether the investor paying for it ever needed one.
Build the retirement of your dreams with our
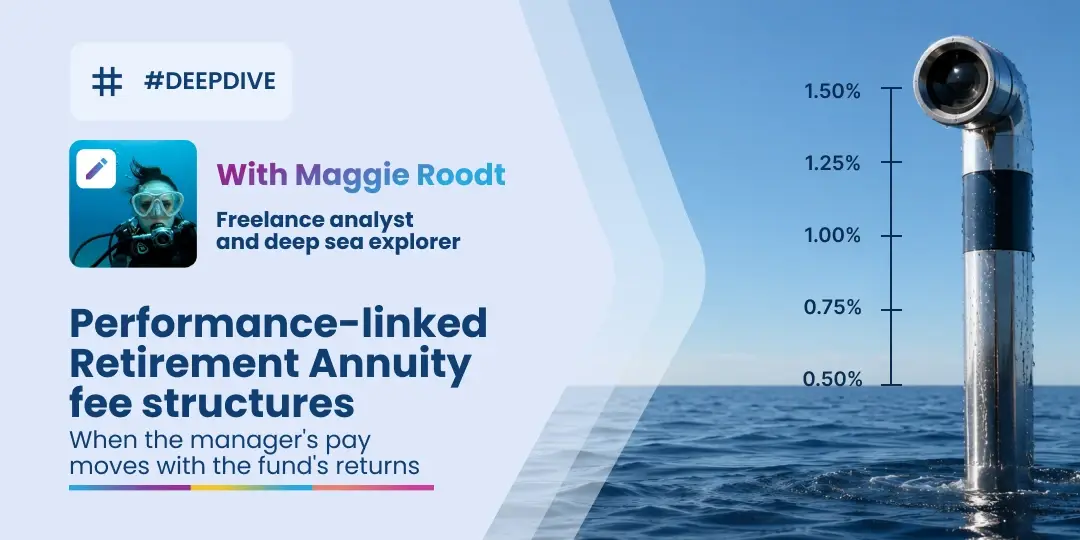
Retirement Annuity calculatorEvery other fee structure in this series has a fixed percentage determined at the outset which remains unchanged by whatever the market does afterwards. The performance-linked structure doesn’t. The fund manager's own pay is tied directly to how the fund performs against its benchmark, recalculated on a rolling basis and disclosed as a range rather than a single rate. Beat the benchmark, and the fee climbs toward its ceiling. Fall short, and it drops toward its floor. Of the five structures in this series, this is the only one where the number quoted today is not the number an investor is locked into for the year ahead.
On the benchmark R500,000 investment, that works out to a total expense ratio of 1.69%, R8,450 in Year 1. The management fee inside that number is currently sitting close to its own 1.50% ceiling; add the fixed 0.23% administration fee on top of it, and 1.69% is where the total lands. But what does that range actually look like, and what does outperformance mean once the measurement behind it is examined?
The anatomy of the performance fee
The management fee is where the movement lives. Everything stacked underneath it is fixed, quoted once, and unaffected by how the fund performs in any given year.
- A management fee that moves with performance. At benchmark, the fee is 1.00% a year (excluding VAT). For every percentage point the fund's return sits above or below its benchmark, measured over a rolling two-year window, the fee moves by roughly 0.10%, up to a ceiling of 1.50% and down to a floor of 0.50%. The manager's share works out to roughly a fifth of the fund's relative outperformance above the benchmark. The floor is not zero. Even in a year of underperformance, a minimum management fee still applies.
- An administration fee, built into the price of the underlying units rather than deducted as a separate line on a statement. For this fund, that fee is 0.23% a year including VAT.
- Trading costs, disclosed separately from the headline percentage and not included in it. They apply to every fund in this comparison regardless of provider, but whether they sit inside the headline or outside it is not consistent across the five.
There is no upfront fee and no compulsory advice fee. An investor can access this fund directly or through a financial advisor, and the advisor's own fee is negotiated separately and does not form part of the fund's own charge.
The two-year window matters here. There is no permanent high-water mark carried forward indefinitely, just a tide that resets every two years, whether the fund's relative performance over that window has come in or gone out. A run of underperformance older than two years no longer counts against the fee calculation, and a run of outperformance older than two years no longer counts in the investor's favour either.
What the fee costs at different levels of relative performance:
| Fund performance vs benchmark | Fee charged |
|---|---|
10 percentage points below | 0.50% (floor) |
5 percentage points below | 0.50% (floor) |
At benchmark | 1.00% |
5 percentage points above | 1.50% (ceiling) |
10 percentage points above | 1.50% (ceiling) |
The 1.69% total expense ratio is made up of a management fee sitting close to its 1.50% ceiling, with the fixed 0.23% administration fee stacked on top. Neither figure is arbitrary. The management fee's position near the ceiling is a direct function of the fund having outperformed its benchmark over the periods that currently count toward the calculation, not a fixed number set at outset.
Compare your retirement investments
Effective annual cost calculatorThe bill over thirty years
This is the same thirty-year model used throughout the series. Because this fee moves, the projection below has to hold it still, assuming the current 1.69% rate for all thirty years, the same simplification every provider's own long-range illustration relies on.
| Metric | Value |
|---|---|
Headline (Year 1, all in) | 1.69% |
Year 1 cost | R8,450 |
Total fees over 30 years | R1,110,000 |
Final portfolio value | R5,122,000 |
Of the five fee structures in this series, this one produces the second-highest total fee bill over thirty years, behind only the advice-led model. But it is the only one of the five where that number is not fixed. If the fund's relative performance over future two-year windows drops toward its floor, the real 30-year bill would come in lower than this projection.
Retirement Annuity vs Tax-free Savings Account vs Bond: Where Should Your Extra Money Go?
Got extra money to invest? Compare three powerful options: Retirement Annuity, Tax-Free Savings Account (TFSA), or paying off your bond faster. Learn the pros and cons of each to make an informed choice for your financial future. Read more

What the movement gets right
- The fee is symmetric, not one-directional Research on performance-fee design has generally found that fees which reward outperformance but never penalise underperformance give a fund manager an incentive to take on more risk, since the manager benefits from big wins and is insulated from big losses. It was this concern that led the US Securities and Exchange Commission to prohibit asymmetric performance fees in American mutual funds in 1971, requiring what regulators call a fulcrum fee, a structure with both a ceiling and a floor. This fee has both.
- The floor can undercut every other headline rate At its 0.50% floor, the management fee alone works out to R2,500 a year on R500,000, below the transaction-based platform's 0.55% and the layered structure's 0.81%. No other model in this series has a management fee that moves down when the fund underperforms. Add this fee's own 0.23% administration charge, though, and the total floor cost comes to roughly R3,650 before trading costs, which is above the transaction-based platform's R2,750 headline. The floor makes the management fee the most responsive of the five, not the cheapest all-in cost.
- Net returns have beaten the benchmark at every horizon Over the periods most recently reported, the latest 1-year, 3-year, and 5-year annualised returns all sit ahead of benchmark, after all fees. The fund also carries a track record stretching back several decades, over which its returns have consistently outpaced its peer group on a rolling basis.S&P's SPIVA scorecards, which track actively managed funds against their benchmarks across markets including South Africa, have consistently found that most active funds underperform their benchmarks over most time horizons. Judged against that backdrop, a fund with net outperformance across three consecutive horizons and a multi-decade track record is not the norm.
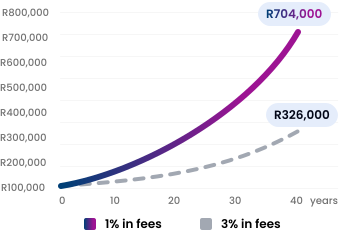
Higher fees very likely means lower returns (and here's the maths to prove it)
Paying high fees on your retirement investments (such as a retirement annuity or a living annuity) almost always means less money in your pocket, and less money for your retirement. Read more
What the movement doesn't guarantee
- The fee looks backward, not forward Because the assessment period is a rolling two years, an investor who buys in after a strong run pays a fee calibrated to performance they were not invested for. The fee accrues from the date of investment, but the performance measurement that sets its level covers the two years before that fee is calculated, not the two years the new investor actually experiences. As one behavioural finance commentator points out, this kind of structure can leave new investors paying higher fees for a run of outperformance they never actually held units for themselves.
- The benchmark is a peer average, not a market index The fund's benchmark is not a market index, but the average return of comparable funds across the broader industry. This means the manager is paid a performance fee for beating other managers, not necessarily for beating the market or inflation. If the entire peer group performs poorly, the fund can earn a performance fee simply by being less poor than the average.
- It never reaches zero The floor protects an investor from paying the full 1.50%, but it does not protect them from paying nothing. A 0.50% minimum management fee is charged every year regardless of how far below benchmark the fund falls.
- The fee is set by history, not by what comes next S&P's companion Persistence Scorecards have found that funds which beat their benchmark in one measurement period are, on average, no more likely than any other fund to do so in the next, with few funds able to stay in the top quartile from one window to the next. The current 1.69% TER reflects results already achieved. It says nothing certain about the fee an investor will actually pay across the next thirty years.
- The mechanism is harder to verify than a flat number A rolling two-year hurdle, a floor, a ceiling, and a sharing ratio are more moving parts than a single percentage, making this fee harder for an investor to model than most of the other structures in this comparison. Academic research on European mutual funds found that performance-fee funds returned about 0.5% less a year, after fees, than comparable funds without one. This was often because the benchmark they were measured against was easy to beat.
9 out of 10 people do better with 10X
The investor experience
On the review platform HelloPeter, this provider holds a rating of 2.11 out of 5, based on 18 reviews logged in the last 12 months, a far smaller sample than the 542 reviews behind the advice-led provider's score in Episode 2. On the same platform, the same business carries a Net Promoter Score of 60, in the "very likely to recommend" range, and ranks 77th among businesses in the Financial Services category. A star rating built on 18 reviews and an NPS score built on a separate, larger sampling method can tell two different stories about the same business at the same time. A reader comparing providers on review platforms should know that sample size changes how much weight a headline rating deserves.
The reviews themselves follow a familiar pattern for a financial services company, with the usual complaints about delays. Positive reviews cluster around individual staff members, praising specific consultants by name for patience and follow-through.
Transferring out takes 6 to 8 weeks under this provider's stated process, the same timeframe quoted for the layered and transaction-based platform structures elsewhere in this series, and considerably shorter than the up to 180 business days quoted for the advice-led model.
A fixed deposit? No thanks!
Moneyweb regular Jimmy Moyaha discusses the problems with that old bank favourite, a fixed deposit, and what else you can do with your money. Read more
Who it's for
This structure suits an investor who is comfortable with a fee that moves rather than one fixed at the outset. It suits someone willing to look past a single year's number to the two-year window behind it, and prepared to hold through a full measurement cycle rather than judge the fund on any one year alone.
It is harder to model in advance than a flat percentage. It is harder to be certain about over thirty years. Both come down to the same reason: it is built to move.
How it compares
| Metric | Performance-linked | Advice-led | Single all-in (10X) | Layered | Self-directed platform |
|---|---|---|---|---|---|
Headline | 1.69% | 2.88% upfront + ~1.38% ongoing | 1.04% | 0.81% | 0.55% |
Year 1 cost | R8,450 | ~R17,000 | R5,200 | R4,373 | R2,750 |
Total fees, 30 yrs | R1,110,000 | ~R1,138,000 | R842,000 | R694,000 | R766,000 |
Final value, 30 yrs | R5,122,000 | ~R4,795,000 | R6,092,000 | R6,592,000 | R6,343,000 |
advisor | Optional | Central | None | Optional | None |
Transfer out | 6–8 weeks | Up to 180 business days | 6–8 weeks | Not specified | A few weeks |
What separates this fee from the other four in this series is not what it costs. It is that the number on the page is a record of what has already happened, not a promise about what happens next. What it has not done, over the periods measured, is fail to beat the benchmark it is priced against.
Next, we’ll assess the layered fee: two separate line items, an administration charge and a fund management charge, stacked on top of each other and disclosed as if they were one number.
Related articles



How can we 10X Your Future?
Begin your journey to a secure future with 10X Investments. Explore our range of retirement products designed to help you grow your wealth and achieve financial success.